
Google has rolled-out – PSI Speed Score Update in its PSI (Page Speed Insight) tool to make a user more comfortable with the speed matrix. With this new feature, a user can check whether the website has enough FCP and DCL data or needed an in-depth optimization to get optimized speed results. Although the basic optimization score is still available with it and showing similar data as previous, but the new feature might make you excited or can confuse about the speed matrix, you are looking at PSI tool.
Don’t get into a hassle, keep calm when you see the speed data unavailable on PSI tool for your website. As the new update rolled out just a few days before, it is showing results for most browsing websites or for those, whose real-world performance data incorporates with Chrome User Experience Reports (CrUX).
We have done a simple speed test analysis through Page Speed Insights (PSI) tool for rginfotech.com and pinterest.com, to check out the speed data-
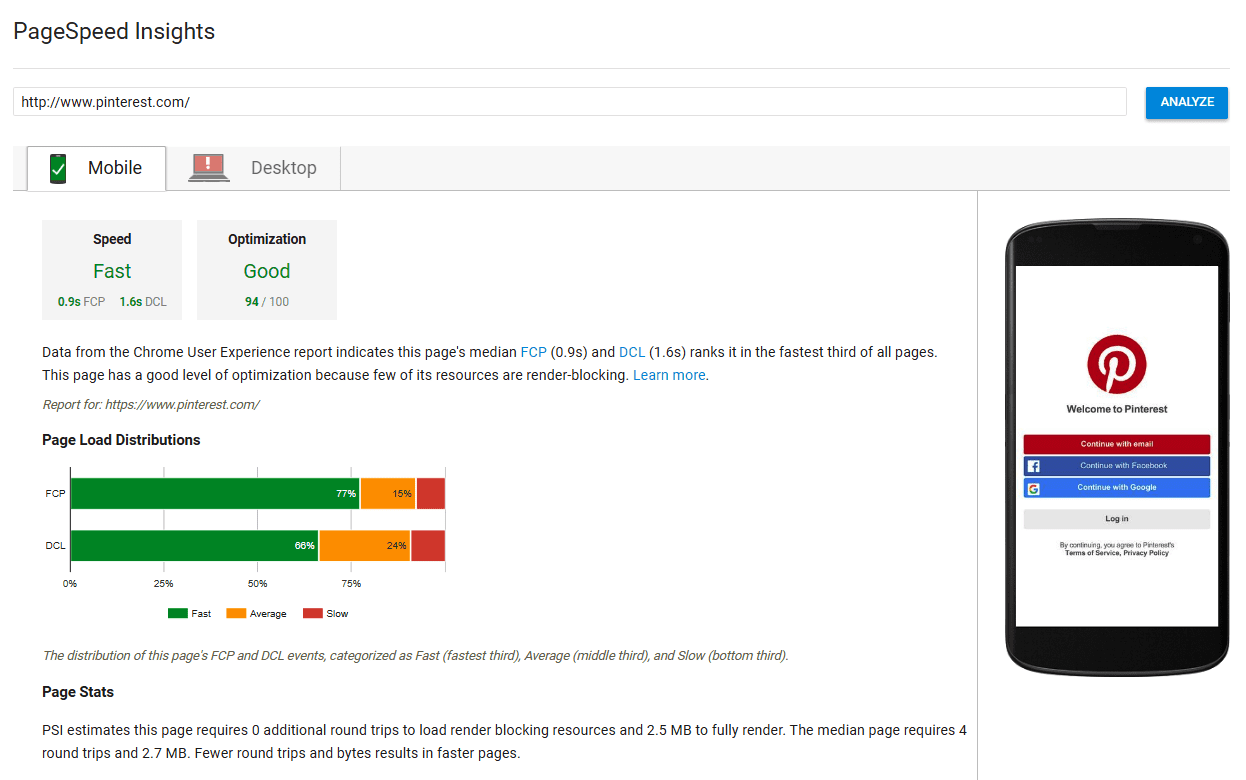
Pinterest PSI test Report
Pinterest PSI test Report
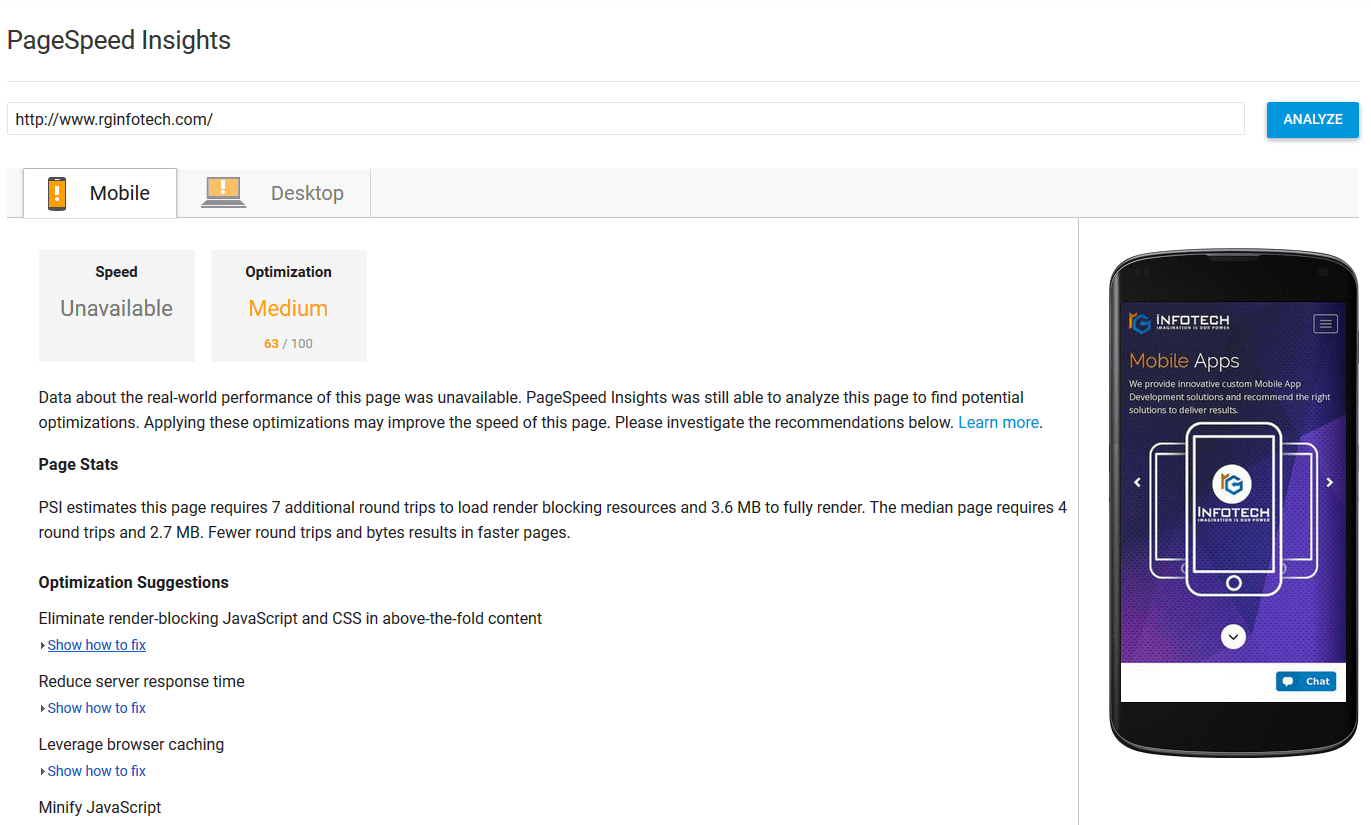
As per the PSI Speed Score Update, here at Pinterest.com, we can see the speed for mobile optimization is fast along with 0.9s FCP and 1.6s DCL metrics. Whereas for rginfotech.com, we got an “unavailable” tag with a bottom line – “Data about the real-world performance of this page was unavailable”.
Let’s explore the details about PSI Speed Score update!
According to Google docs, PSI speed score now incorporates Chrome User Experience Reports (CrUX) to generate data from real-world performance. It included two metrics – FCP and DCL to measure the speed of a web page.
What does FCP and DCL means?
In general, FCP stands for “First Contentful Paint”, whereas DCL stands for “DOM Content Loaded”, both terms are used to define the loading speed of HTML documents (CSS, JS, etc.) and the very first content that can be raw text, images, background, anything.
As per the developer.google.com (source):
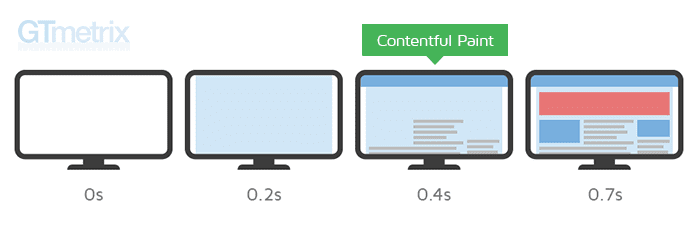
First Contentful Paint (FCP)
“First Contentful Paint reports the time when the browser first rendered any text, image (including background images), non-white canvas or SVG. This includes text with pending webfonts. This is the first-time users could start consuming page content.”
Check out the illustrator beneath, to understand the First Contentful Paint (explained by GTMetrix)
DOM Content Loaded (DCL)
“The DOMContentLoaded reports the time when the initial HTML document has been completely loaded and parsed, without waiting for stylesheets, images, and subframes to finish loading.” – MDN.
What is the category distribution?
“PSI Speed Score update” optimize webpage resources on the render browsing experience and typically categorized into the Fast, Average and Slow categories according to their median values. If a webpage loads both metrics (FCP & DCL) under 2 seconds or in top one-third of their category, it will be considered as fast. Take a look, at the category distribution options:
- Fast: The median value of the metric is in the fastest third of all page loads.
- Slow: The median value of the metric is in the slowest third of all page loads.
- Average: The median value of the metric is in the middle third of all page loads
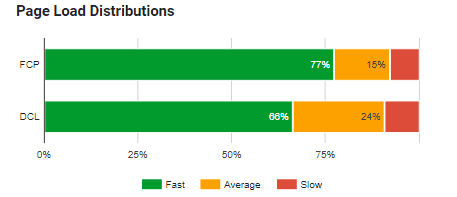
What’s the Page Load distribution?
In the PSI Speed Score section, PSI also reveals the Page load distributions. Where it shows the insights of FCP and DCL metrics according to their CrUX dataset. For both metrics, it splits the distribution into three categories – Fast (fastest third) represented in green section, Average (middle third) represented in orange section and Slow (slowest third) represented in red section.
How to optimize for speed score?
As the update was rolled out just a few days before, it is possible that Google can get real-world performance data for new websites, sooner. But before that, we have to do simple tasks to make it reliable and faster.
- We have to collect performance data through PSI and lighthouse tools, that gives an in-depth detail about page speed.
- Consult with the developer and resolve optimization suggestions provided by the PSI and lighthouse reports.
- Keep your eyes on an above-the-fold content loading, make it compact and speedier to get a better optimization score.
Remember, making changes according to the PSI and lighthouse suggestions, should not affect user experience and the UI of your website. Keep your effort to improve performance rather changing the UI. You can make those changes by yourself (if you know how to code) or can hire expert web development company to make it for you.